Showing posts with label PPI. Show all posts

Wednesday, July 14, 2021

Alan's Alert 7-14-2021


The Producer Price Index (PPI) was released this morning and it came in at 1.0% month-over-month.  This blew the forecast of 0.6% out of the water.  The Core PPI (the PPI without food or energy), forecasted at 0.5%, also came in at 1.0% month-over-month. 


Here’s the summary from the Bureau of Labor Statistics (BLS):
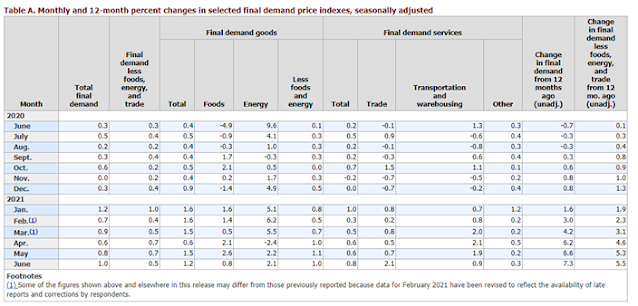


From the BLS report, “On an unadjusted basis, the final demand index moved up 7.3 percent for the 12 months ended in June, the largest advance since the 12-month data were first calculated in November 2010.  Nearly 60 percent of the June advance in the final demand index can be traced to a 0.8-percent increase in the prices for final demand services.”


If you want to see what a new all-time high in year-over-year PPI looks like, the Fed has one for us:


So, why does this matter?  The PPI is different from the CPI (Consumer Price Index) in that it measures the costs from the producer’s perspective rather than the consumers.  Even though producers’ costs are increasing, they don’t always pass those on to the consumer.  That’s why there are two indexes.  If a producer is in a very competitive industry, they may absorb the cost of rising inputs in order to stay competitive.  This would put downward pressure on their profit margins.  It makes for a very tricky situation.  Producers could raise prices on consumers and possibly drive them away, or they could not pass those costs on and struggle to stay profitable.

If you wanted to do get fancy with the charts, you could subtract the producer price index from the consumer price index to see what this “eat the costs” versus “raise prices” dynamic looks like.
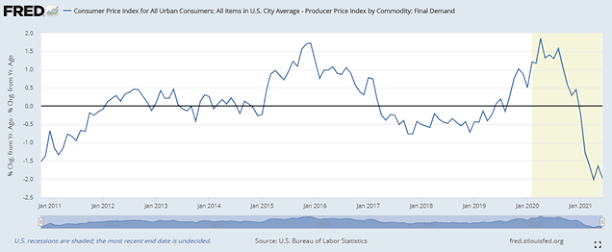
  

From a producer’s perspective, this is not sustainable.  Costs at the consumer level are going to have to rise.  Businesses will only be able to tolerate this for a short period of time.


Since the BLS has changed the way they calculate the PPI over the years, we can’t see what this would have looked like prior to November of 2010.  Fortunately, I’m a total nerd when it comes to all things finance and math.  I dug into the archives of the Fed and have made the following chart:


This is “Final Demand: Finished Goods” subtracted from the CPI.  As you can see, we are looking at levels not seen since the 1970s.


So, what is Fed Chair Jerome Powell going to do today at the Financial Services Committee hearing.  Is he going to stick to the script and announce all is well, nothing to see here or will he start talking about the need to taper and spook the market?  His prepared remarks were released here and it doesn’t look like he is going to waver.  He states, “monetary policy will continue to deliver powerful support to the economy until the recovery is complete”, that the jobs market is “a ways off” and that “substantial further progress” is needed before a taper of asset purchases will begin.  I linked the webcast of the hearing above.  It kicks off at 9AM pacific time.  Don’t expect fireworks, this committee is run by Mad Maxine Waters.  She knows how to ask dull questions and not rock the boat.  I’ll be tuning in but that’s because I’m a geek for this stuff.


Tuesday, June 15, 2021

Alan's Alert 6-15-2021


One of these things is not the like other, one of these things just doesn’t belong. Can you tell which things is not like the others, by the time I finish my song? Did you guess which thing was not like the others?


Above are the charts for retail sales/food services, used cars, and the inventories to sales ratio.  Consumers have come back in droves to retail and food establishments.  They have also not balked at the high prices for used cars.  This has caused the bottom chart (inventory to sales) to drop to a record low.  Usually, I like to look at most charts in a percent change year/year or month/month but with these three, it’s important to see the trend before 2020 and what has been happening since.

With consumers ready to spend, businesses have sold them everything they have on the shelves.  Businesses have been operating on the just-in-time inventory system where management would minimize inventory and reorder when demand required it or projections forecasted it.  This would allow businesses to run leaner on inventory costs and would order from suppliers on a more regular basis.  This management style was pioneered by Toyota in the 1970s and perfected by Walmart.  Unfortunately for retailers, the shutdowns have turned this management practice upside down.

You can see the large spike in inventories to sales as the lockdowns started.  This caused retailers to sit on their inventories as consumers stayed home.  As things have opened up, sales have spiked and retailers are having a hard time securing product for their shelves.  Back-orders, shortages, and shipping delays are regular place now.  


The producer price index printed today.

It came in at 3.2% change month/month (which is 38.4% annualized!), and 19% year/year.  Thankfully we aren’t in uncharted territory here.  Unfortunately, the previous history with PPI this high compares more closely to the early 1970s or the first half of 2008.


Finally, I want to touch on the uranium story that took place yesterday.  Uranium miners had a terrible day as all went down substantially.  The story starts at a nuclear power plant in China.  A French company named Framatome partners with the China General Nuclear Power Group (CGN) to maintain the nuclear power plant at Taishan.  Framatome reported a build-up of noble gases in a reactor at the plant.  Framatome then alerted US authorities to this build-up and subsequent release of gas.  The mainstream press went into meltdown but the reality is that this is a big nothing-burger.  Framatome does business in both China and the US.  They don’t want to be hiding secrets from either partner and want to be transparent.  They also needed US-derived technical information and needed a waiver for that information from their US counterparts.  They wanted to be sure that the releasing of the built-up gases would solve the problem that they encountered.  What was the problem? Cracked fuel rods.  Cracked rods are actually a common problem (usually due to manufacturing defects).  So, what did we learn?  The news obfuscates the truth and yesterday was a day to buy uranium.  I picked up NXE at $4.45/share.  I expect this story to hang around a little bit, so you’ve got time to add to your portfolio, as the uranium story is still intact.