
The Producer Price Index (PPI) was released this morning and
it came in at 1.0% month-over-month.
This blew the forecast of 0.6% out of the water. The Core PPI (the PPI without food or energy),
forecasted at 0.5%, also came in at 1.0% month-over-month.
Here’s
the summary from the Bureau of Labor Statistics (BLS):
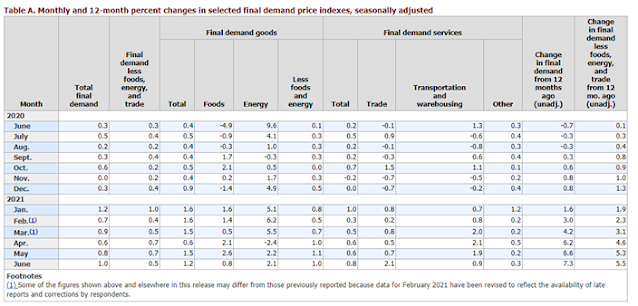
If you want to see what a new all-time high in
year-over-year PPI looks like, the Fed has one for us:

So, why does this matter?
The PPI is different from the CPI (Consumer Price Index) in that it
measures the costs from the producer’s perspective rather than the
consumers. Even though producers’ costs
are increasing, they don’t always pass those on to the consumer. That’s why there are two indexes. If a producer is in a very competitive
industry, they may absorb the cost of rising inputs in order to stay
competitive. This would put downward
pressure on their profit margins. It
makes for a very tricky situation. Producers
could raise prices on consumers and possibly drive them away, or they could not
pass those costs on and struggle to stay profitable.
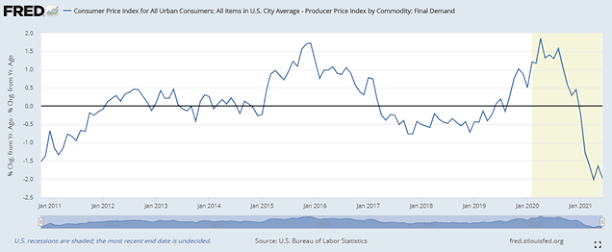
If you wanted to do get fancy with the charts, you could subtract the producer price index from the consumer price index to see what this “eat the costs” versus “raise prices” dynamic looks like.
From a producer’s perspective, this is not sustainable. Costs at the consumer level are going to have
to rise. Businesses will only be able to
tolerate this for a short period of time.
Since the BLS has changed the way they calculate the PPI over
the years, we can’t see what this would have looked like prior to November of
2010. Fortunately, I’m a total nerd when
it comes to all things finance and math.
I dug into the archives of the Fed and have made the following chart:

This is “Final Demand: Finished Goods” subtracted from the
CPI. As you can see, we are looking at
levels not seen since the 1970s.
So, what is Fed
Chair Jerome Powell going to do today at the Financial Services Committee
hearing. Is he going to stick to the
script and announce all is well, nothing to see here or will he start talking
about the need to taper and spook the market?
His prepared remarks were released
here and it doesn’t look like he is going to waver. He states, “monetary policy will continue to
deliver powerful support to the economy until the recovery is complete”, that
the jobs market is “a ways off” and that “substantial further progress” is
needed before a taper of asset purchases will begin. I linked the webcast of the hearing
above. It kicks off at 9AM pacific
time. Don’t expect fireworks, this committee
is run by Mad Maxine Waters. She knows
how to ask dull questions and not rock the boat. I’ll be tuning in but that’s because I’m a geek
for this stuff.

Hi so "PPI-CPI" trend must set to zero as otherwise implies a trend of ever-rising profitability (or ever-decreasing), but can average zero over an inflationary period as long as the two match (as they are both subject to the same inflation rate). The period 1975-76, and 1976-77 has 5% and 5% adjustment (being -7.5 -> 2.5 from trough to peak).
ReplyDeleteSorry this is just to check I am following you because 5% a year doesn't look too dramatic, but ! the true implications of the chart are that -whatever the paired inflation rate of CPI and PPI is-, if history were to repeat, there would be an additional 5% a year on top to cope with the sudden burst in PPI inflation.
i.e. Whatever the inflation rate is, there is an additional top up in inflation coming from producer price adjustment. e.g. if there 4% background inflation (I don't know a better term), then we would see 9% as a consequence of producers repricing.
Is this right? And is this why inflation is always considered lagging? Because the producers essentially swallow a two year delay? (or have done in the past)
I think you've got the right idea but keep in mind, the PPI and CPI are not an apples to apples comparison. This means the numbers will not translate directly into an inflation percentage. In addition, the government has constantly adjusted their inflation tracking formula.
ReplyDeleteThink of this graph as more of a guide. When the trend is below 0, businesses are struggling to pass on their rising costs to consumers and their profit margins are in decline. When the trend is above 0, businesses are passing rising costs on easily and/or increasing profit margins.
The takeaway from this chart (which you have correct) is that inflation figures are already running hot for the year and we haven't seen businesses begin to pass on their costs.
I think the lagging issue has to do with businesses being reluctant to pass on their costs and lose market share or drive customers away. So they pass on these costs slowly over time.